
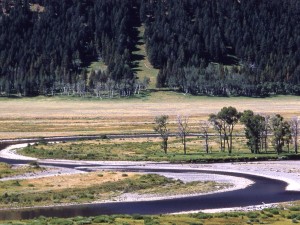
The Lamar River on Yellowstone’s Northern Range showing a typical riparian zone prior to the reintroduction of the wolf. – National Park Service Photo
Preface – Arthur McKee, a forest ecologist, friend of the Water Closet and an occasional contributor, has sent an account of dynamic changes in the ecology along the streams and rivers of Yellowstone Park’s Northern Range. Changes along our Ipswich River have been the topic of many Water Closets in the past eight years. Our animals aren’t as big or our river as large. We simply observe and report. Art’s friends do that and then study to determine causes.
LIVES ALONG THE RIVER ARE A CHANGIN
by Arthur McKee (not Bob Dylan)
An appealing short film asserts that the reintroduction of wolves into the Yellowstone National Park has had remarkable positive effects on the riparian1 vegetation along river banks. While it is true that the presence of wolves has caused dramatic changes in bison and elk feeding habits, moving them away from the river’s edges, the story is not quite so simple. Two of my colleagues at Oregon State U, Bill Ripple and Bob Beschta (a landscape ecologist and hydrologist respectively) have promoted this idea largely based on analyses of satellite imagery, and it has received considerable attention in the media.
Another pair of scientists at the not-for-profit Yellowstone [pullquote]wolves have had an impact on deer, elk and bison populations and behavior[/pullquote] Ecological Research Center (YERC), a landscape ecologist and wildlife ecologist specializing in wolf-coyote-fox interactions, have conducted long-term research at Yellowstone since the late 80s, well before wolf reintroduction. YERC’s field crews have sampled changes in vegetation and wildlife behavior/population dynamics for 20-plus years, covering the pre- and post-wolf reintroduction periods.
Both groups agree there is no question that wolves have had an impact on deer, elk and bison populations and behavior, and that there is less browsing of riparian vegetation. But, just a few years after the wolf reintroduction, a major flood occurred across the Northern Range. The timing created near perfect seed beds for germination and growth of cottonwood and alder seedlings. And, cuttings from beaver activity of willows and other stream-side shrubs were widely dispersed and buried in the sediments. A wave of tree and shrub regeneration took place that was way beyond anything previously observed, far outstripping the browsing capacity of the deer, elk and bison. With all the new food available, the heavily browsed shrubs were free to grow. They took off, with many rapidly outgrowing the grazers’ height limits.
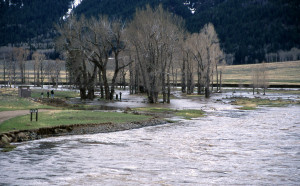
The Lamar River during a rising flood a few years after wolf reintroduction that created many opportunities for seedlings in the riparian zone. – National Park Service photo
A serious five-year drought occurred in the early 2000s that severely harmed vegetation away from streams and reduced the seasonal flooding and erosion. This in turn allowed the stream sides to stabilize. It’s hard to separate the one-two punch of the flood and drought on the riparian vegetation from the wolf-driven trophic-cascade effect2. Either could have caused the changes observed. Both undoubtedly played roles, but ranking one over the other remains in doubt.
[pullquote]Wolves prey on coyotes which in turn prey on foxes[/pullquote]Wolves prey on coyotes which in turn prey on foxes. Following the reintroduction, the YERC scientists saw coyote populations drop and fox populations increase. The rabbit/hare/mice populations stayed about the same, while ground squirrel and pocket gopher populations soared for reasons that will be described below. The fox populations have also benefited from the increases in squirrels and gophers. Beaver populations remained pretty constant for years but have started to gradually increase in response to enlarged resources. Otter populations have stayed about the same.
In addition, the natural vegetation away from streams died back from drought and increased grazing by deer, elk, and bison — who avoided the tall shrubs and new trees along the streams as well as regenerating aspen groves. That new vegetation provided cover for wolves, and their prey preferred to be in the open grasslands where they could see the wolves approaching. This combination of drought and heavy grazing led to rapid expansion of invasive weedy species, in particular Canadian thistle. The latter produces, and partly spreads by, rhizomes3 that are rich in carbohydrates and are a preferred food for ground squirrels and pocket gophers.
Ground squirrels and gophers collect and cache huge quantities of the rhizomes, which have become a major alternative fall food for grizzly bears during their gorging phase just prior to hibernation. Grizzlies used to rely on the seed crops of white-bark pine, but that species is dying out from blister rust. This changing situation poses a management dilemma for the Park and adjacent National Forests, mandated to maintain viable populations of native species and eradicate exotic ones. If the Canadian thistle is reduced through some management activity, grizzlies, which appear to be nearing the system’s carrying capacity anyway, are apt to go into decline.
Nope, it’s not a simple straightforward story at all*.
* Note: In biology class you probably studied food webs. You can see how very complicated they can be. Let’s play a bit with Sir Walter Scott’s famous lines from his poem Marmion by replacing deceive with relieve. –
Oh what a tangled web we weave /When we first practice to relieve. (i.e. relieve the pressure in a food chain)
1 Riparian – area along a river or stream
2 Trophic cascade – the changes resulting from the addition or removal of top predators in a food chain.
3 Rhizome is an underground stem.
———————————————————————–
WATER RESOURCE AND CONSERVATION INFORMATION
FOR MIDDLETON, BOXFORD AND TOPSFIELD
`
| Precipitation Data* for Month of: | Dec | Jan | Feb | March | |
| 30 Year Normal (1981 – 2010) Inches | 4.12 | 3.40 | 3.25 | 4.65 | |
| 2013 – 14 Central Watershed Actual | 5.30 | 3.47 | 3.20** | 0.00 as of 3/4** | |
Ipswich R. Flow Rate (S. Middleton USGS Gage) in Cubic Feet/ Second (CFS):
For March 4, 2014: Normal . . . 114 CFS Current Rate . . . 63 CFS
*Danvers Water Filtration Plant, Lake Street, Middleton is the source for actual precipitation data thru Jan. Normals data is from the National Climatic Data Center.
**Updated Feb and March precipitation data is from MST gage.
THE WATER CLOSET is provided by the Middleton Stream Team: www.middletonstreamteam.org or <MSTMiddletonMA@gmail.com> or (978) 777-4584
Chung toi chuyen:
– bang quang cao tphcm
– bien bat 3m
– gia cong chu inox
– mica hut noi
– hop den mica
Lien he sdt/zalo: 0947.85.0022
Website: dinhphanadvertising.com